An analysis of board games: Part III - Mapping the board game landscape
Posted on Fri 04 September 2020 in Analysis
This is part III in my series on analysing BoardGameGeek data. Other parts can be found here:
- Part I: Introduction and general trends
- Part II: Complexity bias in BGG
- Part III: Mapping the board game landscape
Introduction
Previous posts in this series cover how we generated a dataset from BoardGameGeek, explored general trends in the tabletop games landscape over time and looked at complexity bias inherent in the BGG dataset. This post explores a comparison of game ratings at an individual user level to determine which games are similar and use that to create a map of the board games landscape.
Data collection
Before we are able to perform any user-level ratings analysis, we need to collect a dataset that contains game ratings at an individual user level since the previous dataset in parts I and II used an average rating for each game. Extracting individual-account-level information from Board Game Geek is possible using their XML API, but is more challenging and time-consuming than extracting game-level aggregates due to some constraints in the API (e.g. limited to 100 user-level ratings per request). As such, obtaining a comprehensive list of all game ratings by each user for all games in the BGG database was not considered a viable approach. Instead, the individual user level ratings were obtained for 500 of the most populer (by Ownership) games on BGG, with an additional 53 hand-picked to sample some of the more recent successful titles, including Wingspan, Res Arcana, etc. Those criteria bring down the total number of user-level ratings to be collected considerably, but still amounts to 7.5 million individual game ratings at a user level. Those 7.5 million user-level game ratings covering 553 successful games were collected and were found to contain ratings from 265,374 unique BGG accounts.
The dataset is currently in a SQLite database. If anyone would like a copy of the data, please let me know.
User-Driven Similarity
Having collected individual game ratings per BGG user, we can take any pair of games, find the users that have provided ratings for both of these games and see how the ratings across games are related. There are a few examples below showing that BGG users who tend to like Monopoly tend to also like Risk. Similarly, users who like Yahtzee tend to also like UNO. On the other hand, users that like Monopoly aren’t any more likely to enjoy Twilight Struggle, and users liking UNO tells us nothing about their affinity for Scythe. The extent to which ratings of games are correlated indicates how likely it is that users will like one game if they like the other. It’s important to highlight that when we say a user “likes” a game here, we are always talking in relative terms. It means that users that like game A more than average are likely to enjoy game B more than average too if their ratings are positively correlated.
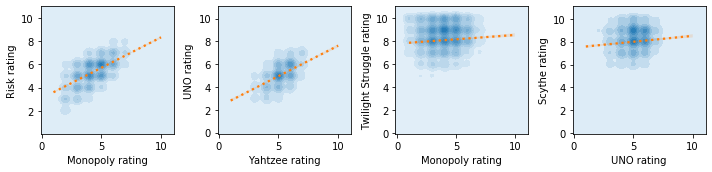
The correlation of user-level ratings between games can be interpreted as some form of similarity between games. After all, if the users who tend to like one tend to also like the other, there will presumably be something similar between the games. However, the similarity between the games may not be obvious based on a traditional board games classification taxonomy. What the correlation captures is essentially games that “scratch the same itch” or tap into a similar core appeal. This could be the feeling of solving an abstract puzzle, a thematic appeal, the social-component, the rewarding feeling of building an elegant engine, the feeling of cooperating with friends, or any other. The games may have very different mechanics, themes, complexity levels or even overall average ratings, but likely tap into a similar core appeal, and that core appeal will resonate with some groups of BGG users more than others.
Scaling up the comparisons
Now that we’ve introduced the concept of game similarity based on user-rating correlations, we can calculate the pairwise correlations for all 152,628 unique pairs of games in our dataset. Despite the user-level correlation approach to assessing how similar games are knowing nothing about the games’ type, genre, mechanics, complexity level, rating, designers, or anything tangible about the game, the similarity approach is able to identify that remakes or alternate versions of the same game are very similar (e.g. Codenames, Codenames: Pictures and Codenames: Duet, or Brass: Lancashire and Brass: Birmingham). This approach also finds, rather reassuringly, that games that we would intuitively class as being broadly similar tend to have high user-level rating correlations as well. For example, One Night Ultimate Warewolf, Secret Hitler, Coup, and The Resistance are all light party games based on communication and deception. They all end up with high correlations with one another. Similarly, word-games like Boggle, Scrabble, Taboo, Scattergories, Pictionary, Bananagrams also group together in the same way. Another example is the “Easy to learn. Hard to master” strategy cluster of Chess, Go and Diplomacy. These correlations and their general alignment with games that we’d intuitively consider similar allows us to build a simple recommendation system that displays the most similar games to any other game (refer to Dashboard below for an implementation of this)
Mapping the board game landscape
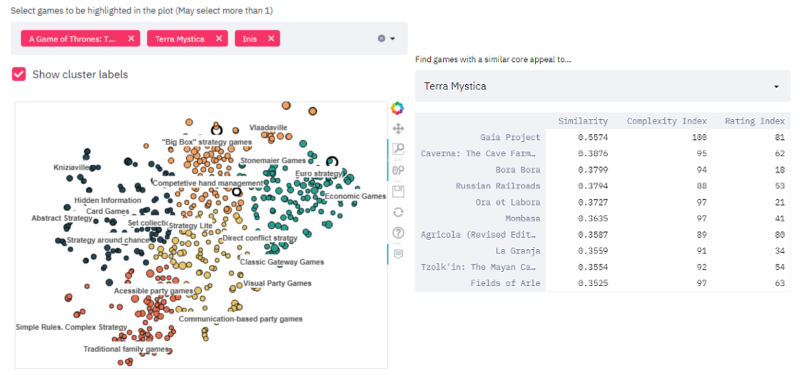
The full grid of 152,628 game similarities is non-trivial to visualise in its native form. To accurately display the similarities between all games in that matrix as distances between points, we would need a 552-dimensional (N-1) graph. Obviously, that’s not really a tractable solution. Fortunately for us, there are machine learning techniques that provide us with an adequate solution to this problem. A technique known as t-Distributed Stochastic Neighbour Embedding (commonly abbreviated as t-SNE) allows us to create a lower-dimensionality projection, or more correctly, a manifold, of the 553 x 553 correlation matrix that attempts to keep points that are close together in the high-dimensionality space close together in the reduced-dimensionality space too. What this means is that we can obtain a set of points in 2D that best preserves adjacency between points close together in high-dimensional space, therefore keeping similar games together. Below is an interactive visualision of the results using this approach. You can hover over any point to get more information on it and a list of its most similar games. There is also an interactive dashboard (see next section) where you can search for individual games to highlight them in the plot.
We can see that the games that we mentioned as being similar above are close to each other in this visualisation. This visualisation also shows that games percieved to be good “Gateway games” such as Catan, Carcassone and Ticket to Ride are also in close proximity to each other (bottom of the light blue group), despite not having many common themes or mechanics between them. Similarly, many pre-1960s traditional family games such as Monopoly, Risk, Battleship or Clue cluster together as well (bottom of the red group). Navigating the plot reveals several groups of games that are intuitively grouped together e.g. Economic Games, Visual party games, communication-based party games, hidden information card games. Interestingly, I found 2 game designers whose games tend to cluster together: Vlaada Chvátil (near the top right of the orange area) and Reiner Knizia (top left of dark blue area). It’s also interesting that in both of these cases, despite there being a very distinct cluster for their games, they each have games that do not belong in their own cluster e.g. Codenames does not appear to belong with the other Vlaada Chvátil games. Similarly, The Quest for El Dorado does not belong with the other Reiner Knizia games. There are many other interesting features in the plot, but they are best left for the readers to explore and discover.
Interactive Dashboard
I’ve built a basic interactive dashboard with more control over the visualisation of the BG landscape seen above, as well as a basic recommendation system that lists the most similar games to any game of interest. It can be found using the link below:
Closing remarks
I hope that the framework presented here helps nudge the discussion around tabletop games and their classification towards a consideration of the games’ core appeal rather than a classification based on some of the games’ trappings and mechanics e.g. “Wargame”, “Thematic game”, “Hex and Counter game”, etc. This analysis also had a useful byproduct of allowing us to create a rudimentary game recommender system based on user-level ratings correlations (recommender available in the dashboard) that will hopefully be useful to some people, despite the limited scope of 553 games.
Thanks to:
- Elizabeth Hargrave: Elizabeth Hargrave suggested that it might be interesting to do a gender-level analysis on the BGG dataset following my previous analysis on board games. That motivated the collection of a user-rating-level dataset, which eventually sparked this idea.
- Colm Seeley for introducing me to the world of modern board games, countless discussions and ideas on interesting things to do with the dataset, and for helping me identify and name many of the clusters in the mapped board game landscape.
- Yihui Fan for suggesting some interesting neural-network-based analysis ideas that could be performed on this data.